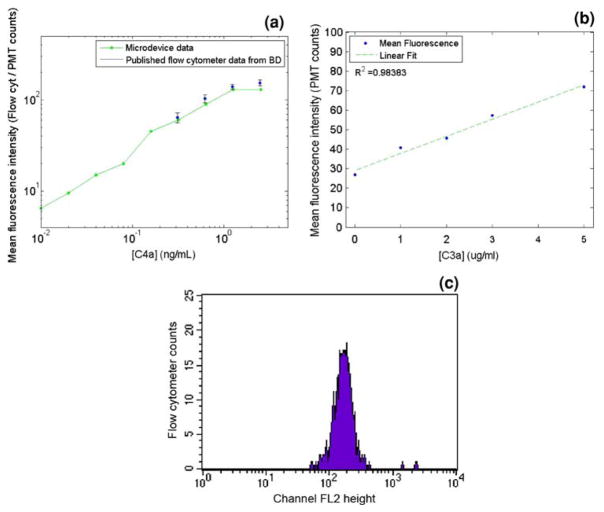
Fig. 6.
a Comparison plot of commercial anaphylatoxin kit published C4a standard calibration curve with fluorescence measurements of the same beads after benchtop C4a incubation according to manufacturer’s instructions followed by infusion through a microdevice with PMT fluorescence detection. b Benchtop-incubated C3a antigen sandwich immunoassay fluorescence results using the paramagnetic immunofluorocytometry beads measured with a Facscaliber flow cytometer. The primary and secondary incubation times were 45 s each. c Representative histogram from flow cytometer for a 5 μg/ml C3a sample with a 2 min bench top incubation. An ideal dataset is expected to show a Gaussian distribution around the mean fluorescence intensity

