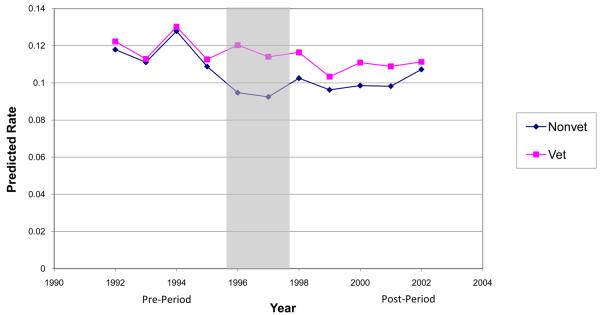
Figure 1a. Predicted Notworking Rates by Year and Veteran Status.
This event study graph shows the predicted means trend for notworking male veterans and non-veterans, aged 55-64 using OLS regressions with indicator controls for age that compared veterans and non-veterans from 1992-2002. The shaded area represents the years of the rollout of the expansion.

