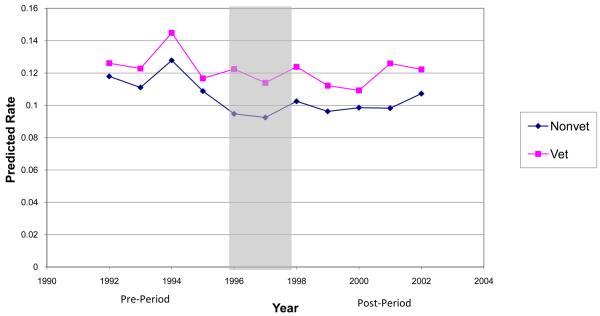
Figure 1b. Predicted Notworking Rates by Year and Veteran Status with Demographic Controls.
This event study graph shows the predicted means trend for notworking male veterans and non-veterans, aged 55-64 using OLS regressions with limited demographic controls (marital status, race, education level, age dummies, and division dummies) that compared veterans and non-veterans from 1992-2002. The shaded area represents the years of the rollout of the expansion.

