Fig. 1.
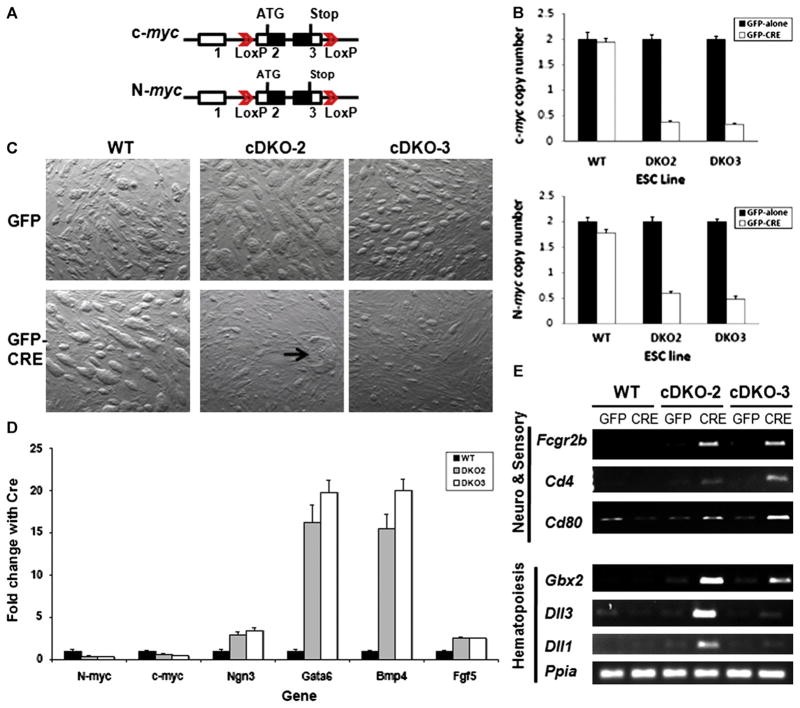
Loss of c- and N-myc disrupts mESC growth and triggers lineage commitment. (A) Schematic of the floxed c- and N-myc loci. (B) Detection of c- and N-myc gene copy number changes by real-time qPCR. Gene copy numbers for c- and N-myc were normalized using two reference genes, β-actin and Nat1. Error bars are standard deviations. Decreases in c- and N-myc copy numbers had p values of 8.3×10⁻⁷ and 7.2×10⁻⁷, respectively, in cDKO2, and p values of 1.6×10⁻⁷ and 2.4×10⁻⁵ in cDKO3, respectively. (C) Phase contrast image of mESC lines in the presence or absence of CRE expression. Arrow denotes differentiated colony. GFP and GFP-Cre denoted cell cultures transduced with MSCV ires-GFP and MSCV Cre-ires-GFP retroviruses, respectively. (D) Real-time qRT-PCR of c-myc, N-myc, and a series of different lineage-specific marker genes in WT and DKO mESC lines. Levels of specific mRNAs measured by qRT-PCR were normalized to the levels of the loading control Nat1. Error bars are standard deviations. Changes in relative expression of N-myc, c-myc, Ngn3, Gata6, Bmp4, and Fgf5 had p values of 7×10⁻⁴, 2×10⁻⁴, 1×10⁻³, 8.6×10⁻⁵, 9×10⁻⁴, and 9.6×10⁻⁴, respectively, in cDKO2 and p values of 8.7×10⁻⁵, 1.4×10⁻⁵, 2.7×10⁻⁴, 3.4×10⁻⁴, 5.1×10⁻⁴, and 1.3×10⁻³, respectively, in cDKO3. (E) RT-PCR of hematopoietic, neural and sensory organ differentiation markers in mESC of the indicated genotype.

