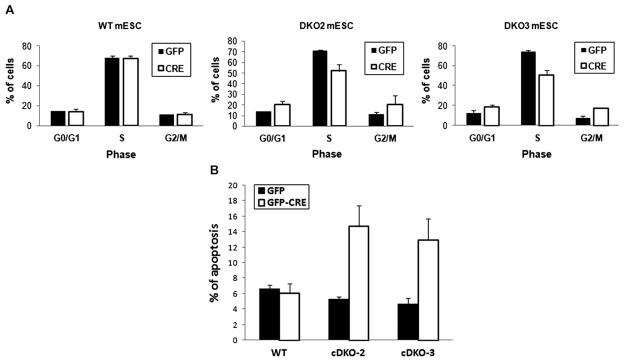
Fig. 5.
Myc is required for cell cycle progression and cell survival of mESC. (A) Cell cycle profiles of WT and cDKO mESC lines were obtained by measuring bromodeoxyuridine (BrdU) incorporation coupled to the staining of DNA content with 7-amino-actinomycin D (7-AAD). Changes in G0/G1, S, and G2/M phases had p values of 0.02, 0.003, and 0.08 for cDKO2 and p values of 0.04, 0.0003, and 0.007 in cDKO3, respectively. (B) Percentage of apoptotic cells in GFP positive populations in mESC lines was measured by Annexin-V staining assay. The data are the means of three biological replicates (n=3) and error bars are standard deviations. Increases in apoptosis had p values of 0.004 and 0.006 in cDKO2 and cDKO3, respectively.

