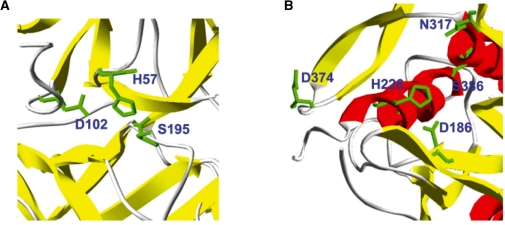
Fig. 3.
Three-dimensional visualization of structures with predicted gain and loss of catalytic residues. (A) F9 protein (1rfn; residues H57, D102 and S195 in PDB structure correspond to H221, D269 and S365 in F9 sequence) where substitution H221R leads to the loss of catalytic activity. (B) PCSK9 protein (2qtw; D186, H226, N317 and S386 are annotated catalytic residues in CSA with evidence code PSIBLAST) where substitution D374Y leads to a 10-fold increase in catalytic activity.

