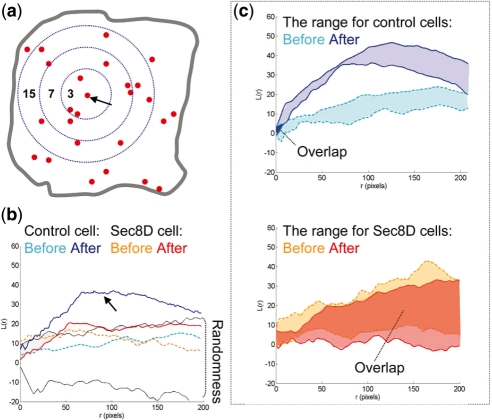
Fig. 5.
A comparison of L-curves of control and Sec8-depleted cells. (a) The scheme illustrates the principle of L-function estimation. The numbers are counts of events within distance r from an arbitrary event (marked by the arrow). The number increases as the radius increases. This counting is repeated for every fusion event. L-function values are estimated for each radius size. (b) L-curves obtained from the control and Sec8-depleted cells shown in Figure 1 (plotted as a function of radius r). The lined area delimits the range of L-function values obtained from a set of simulated random/Poisson point processes (labeled randomness). There are two curves for each cell, one obtained before and one obtained after insulin stimulation. Insulin promotes an upward shift of the L-curve above the envelopes of randomness only in the control cells (arrow). (c) The range of L-function values for control and Sec8-depleted cells before and after insulin stimulation. Notice that ‘before’ and ‘after’ areas do not overlap in the control, but they mostly overlap in the Sec8-depleted group [the overlaps are labeled with dark blue (control) and dark red (sec8-depleted) solid colors, respectively].

