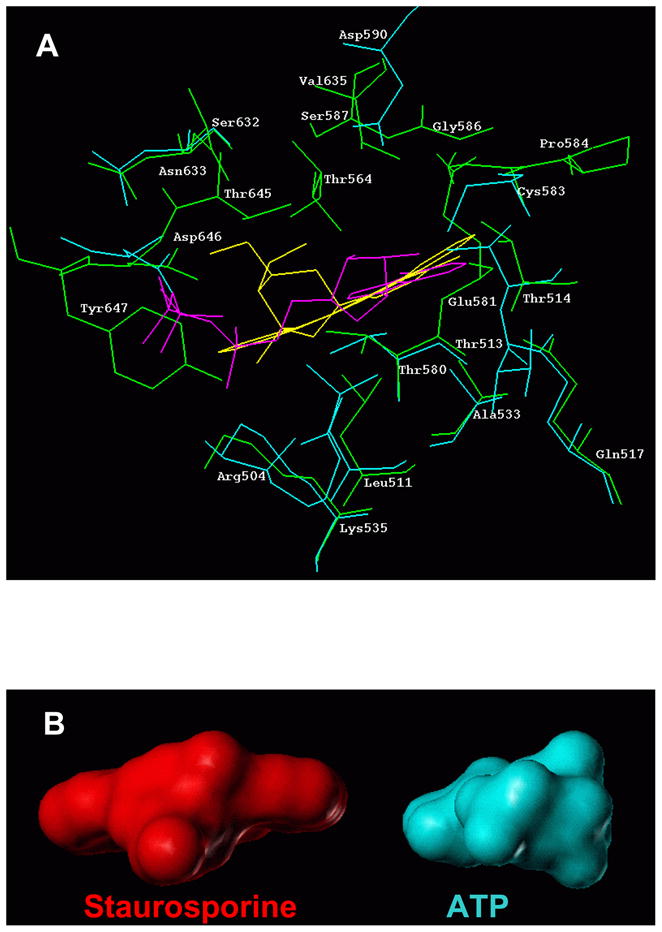
Figure 3.

(A) Docking of staurosporine into the ARM domain of ANF-RGC - Comparison with ATP docking. Staurosporine molecule (shown in yellow) extracted from its complex with SYK catalytic domain (PDB file 1XBC) was docked into the ARM domain. For comparison, docking of ATP (shown in magenta) is also provided. Amino acid residues constituting the staurosporine binding pocket are shown in green while those constituting the ATP binding pocket are in cyan. For clarity, only residues within 4 Å radius around the respective molecule are shown. (B) Models of staurosporine and ATP. The space filling models of staurosporine and ATP are shown side-by-side to illustrate the difference if sizes of the two molecules.
