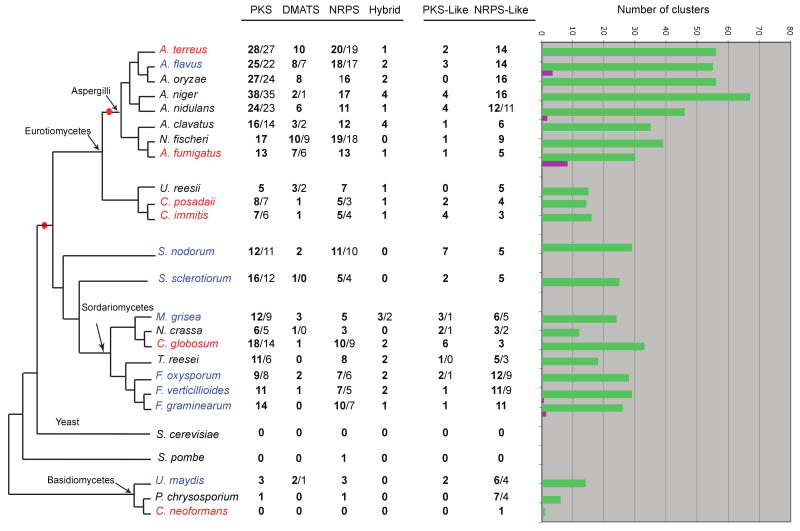
Figure 1.
Numbers of backbone genes and SM clusters in the 27 sequenced fungal genomes we analyzed. The central columns show the numbers of backbone genes of each type in a species. Each column contains two numbers separated by a slash; the first (in bold) is the number of backbone genes, and the second is the number of putative SM clusters predicted by SMURF. If both numbers are identical, only one (in bold) is shown. The tree topology is based on the phylogenetic tree by Fitzpatrick and colleagues (Figure 2 in (Fitzpatrick et al., 2006)). Species named in red are human pathogens (some are also animals and/or plant pathogens), blue are plant pathogens, and black are non-pathogenic fungi. Red bullets mark two internal branches on which enrichment in backbone genes occurred during evolution. In the histograms on the right, green bars show the total numbers of SM clusters predicted by SMURF in each genome (excluding SM clusters containing only PKS-like and NRPS-like genes), and purple bars show the numbers of SM clusters that have been characterized experimentally. PKS, polyketide synthase; DMATS, prenyltransferase; NRPS, nonribosomal peptide synthase.

