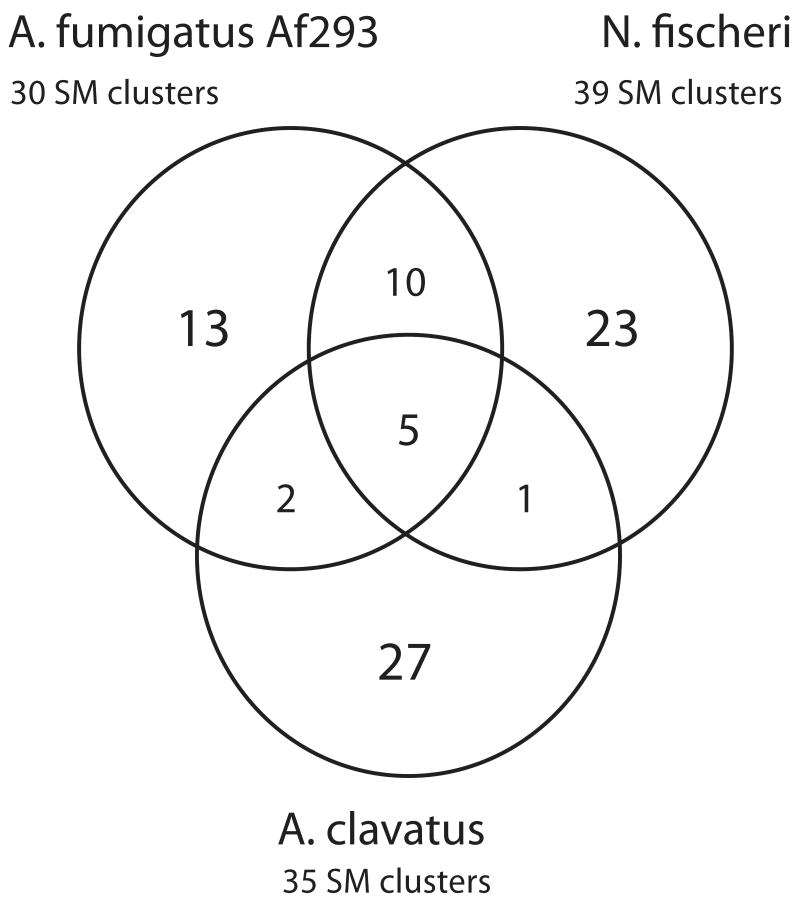
Figure 2. Core orthologous and species-specific SM clusters in A. fumigatus, A. clavatus and N. fischeri.
This Venn diagram shows relationships between putative SM clusters that were identified by SMURF in these three species. Non-overlapping areas represent the number of clusters unique to each species. Overlapping areas represent the number of orthologous clusters shared by two or three species. The total number of clusters is shown under the species name. The figure is not drawn to scale.

