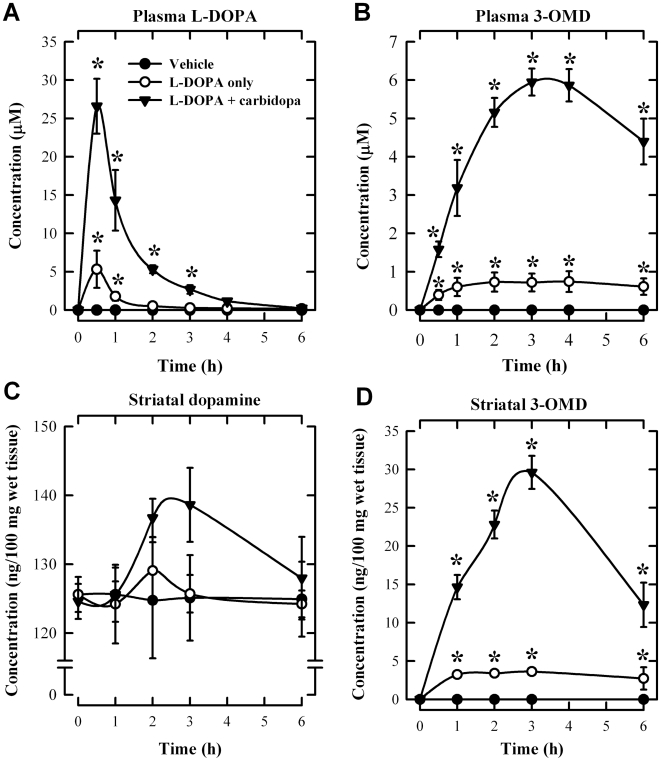
Figure 4. Comparison of the concentrations of the plasma L-DOPA (A), plasma 3-OMD (B), striatal dopamine (C), and striatal 3-OMD (D) in rats.
Blood samples were collected from the tail vein at 0.5, 1, 2, 3, 4 and 6 h after oral administration of L-DOPA (20 mg/kg) alone or L-DOPA + carbidopa (20 +5 mg/kg) (N = 3 for each group). The vehicle group received water administration only. Striatal tissues were collected at indicated time points. Vertical bars indicate the standard deviations (S.D.). * P<0.05 compared to the vehicle group.

