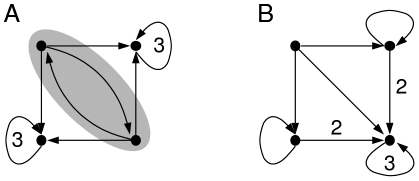
Figure 5. General iteration graph of the strongly connected symmetric component {ap1, ag}.
General iteration graph of the strongly connected symmetric component  of the reduced Mendoza & Alvarez-Buylla network
  pictured in Figure 3 (a) when the states of nodes emf1 and tfl1 are both fixed to
  and (b) when they are both fixed to
  . In this graph, for the sake of clarity, we have represented
  arcs with the same beginning and ending as one unique arc labelled by
  . The sub-graph in grey is a limit cycle of the connected component with the parallel iteration mode. It induces limit cycles 2, 3, 4 and 5 of Table 1. Note that when the state of nodes lfy and lug is fixed to
  in
in  (this always becomes true after a few steps according to the proof of Proposition 1), then the connected component
  is free to evolve as pictured by one of these two general iteration graphs since no other nodes than emf1 and tfl1 whose states are either both
  or both
  have an influence on them.

