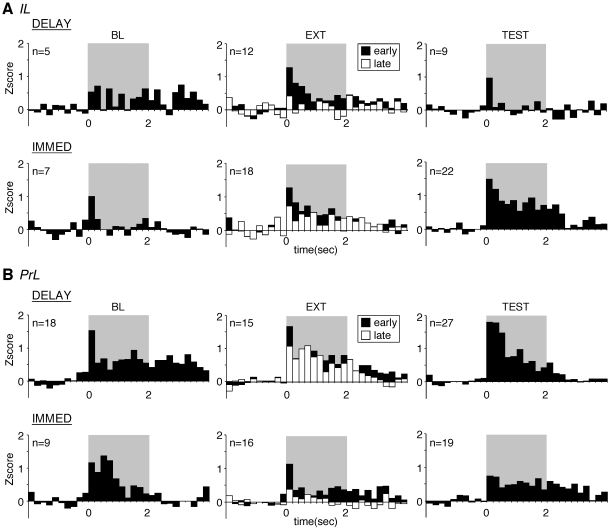
Figure 3. Peri-event time histograms illustrating CS-evoked activity in the IL (A) and PrL (B) during behavioral training.
The number of neurons contributing to each average (Z>0 within 200 ms) is indicated in the panels. (A) For the IL, there was no difference between the IMMED and DELAY groups in firing to tones during the baseline (BL) session (p>0.05) and early extinction (EXT). During the extinction session, only DELAY rats decreased their firing to the CS (p<0.05). Firing to tone CSs was significantly higher in IMMED rats compared to DELAY rats during the test session (TEST, p<0.05). (B) For the PrL, there was no difference between groups in any of the behavioral phases. The 2-sec tone CS period is shaded in gray.

