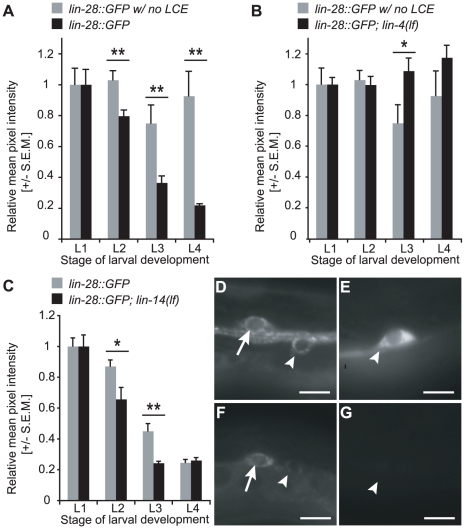
Figure 4. Regulation of lin-28 by lin-4 and lin-14 changes over developmental time.
(A) Relative GFP levels were higher for lin-28::GFPΔLCE (Line 5-1) lacking the LCE than for lin-28::GFP (Line 10-2) with an intact 3′UTR at the L2, L3, and L4 stages. **p-values≤0.01 (0.005 for L2, 0.01 for L3, and 0.002 for L4). (B) Relative GFP intensity was lower at the L3 stage in lin-28::GFPΔLCE (Line 5-1) lacking the LCE than in lin-28::GFP (Line 10-2) crossed into lin-4(lf). *: p-value = 0.030. For A–B, changes in LIN-28::GFP levels across larval development in animals lacking the LCE or lin-4 exceeded the dynamic range of the camera. At the set exposure time, some images acquired for late L4 were oversaturated. n≥10 for each strain and time point. (C) Relative lin-28::GFP (Line 10-2) expression was lower in L2- and L3-stage HSNs in lin-14(lf) compared to wild-type at 23°C. n≥9 for each lin-28::GFP condition and n≥18 for each lin-14(lf); lin-28::GFP condition. *: p-value = 0.019. **: p-value = 0.001. For A–C, data were normalized to L1 values for each strain, p-values for differences in relative pixel intensity were obtained using the two-sample t-test, and error bars represent S.E.M. (D,E) Representative L1- (D) and L4-stage (E) HSNs from lin-28::GFPΔLCE (Line 5-1). (F,G) Representative L1- (F) and L4-stage (G) HSNs from lin-28::GFP (Line 10-2); lin-14(lf). For (D–G), scale bars represent 5 µm, and anterior is left and ventral is down. Arrowhead: HSN. Arrow: CAN neuron.

