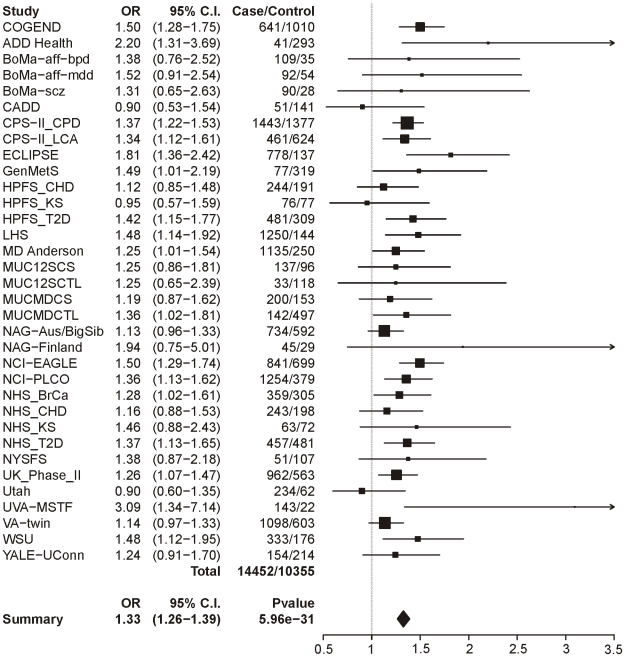
Figure 1. Forest plot for dichotomous CPD at locus 1 (tagging rs16969968).
The ORs and 95% CIs are for the effect per allele using additive coding in the logistic regression with age and sex as covariates. The box size indicates the precision of the OR estimate. The case and control totals include only individuals with a genotype call for locus 1. The heterogeneity p-value is 0.21.

