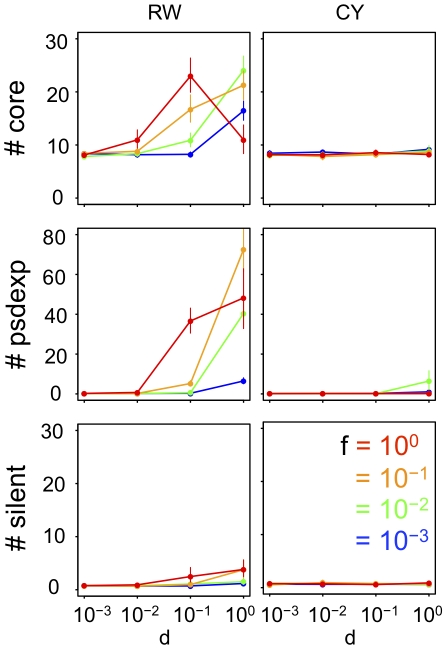
Figure 2. GRN structures that evolved under various fluctuations of phenotypic selection.
The number of core genes (#core), pseudo-expression genes (#psdexp), and silent genes (#silent) in GRNs that evolved for 50,000 generations under random-walk optimum shift (RW), and those that evolved under cyclic optimum shift (CY). All parameters were set at standard values (Table 1). Each point connected by solid lines represents the mean number of each type of genes in evolved GRNs under each selective condition. Vertical bars attached to the point represent 95% confidence intervals. d and f represent the amplitude and frequency of the optimum shift, respectively.

