
Figure 6. Relationship between the intensity of the optimum fluctuation and the fitness effects of gene duplication and gene deletion during evolution.
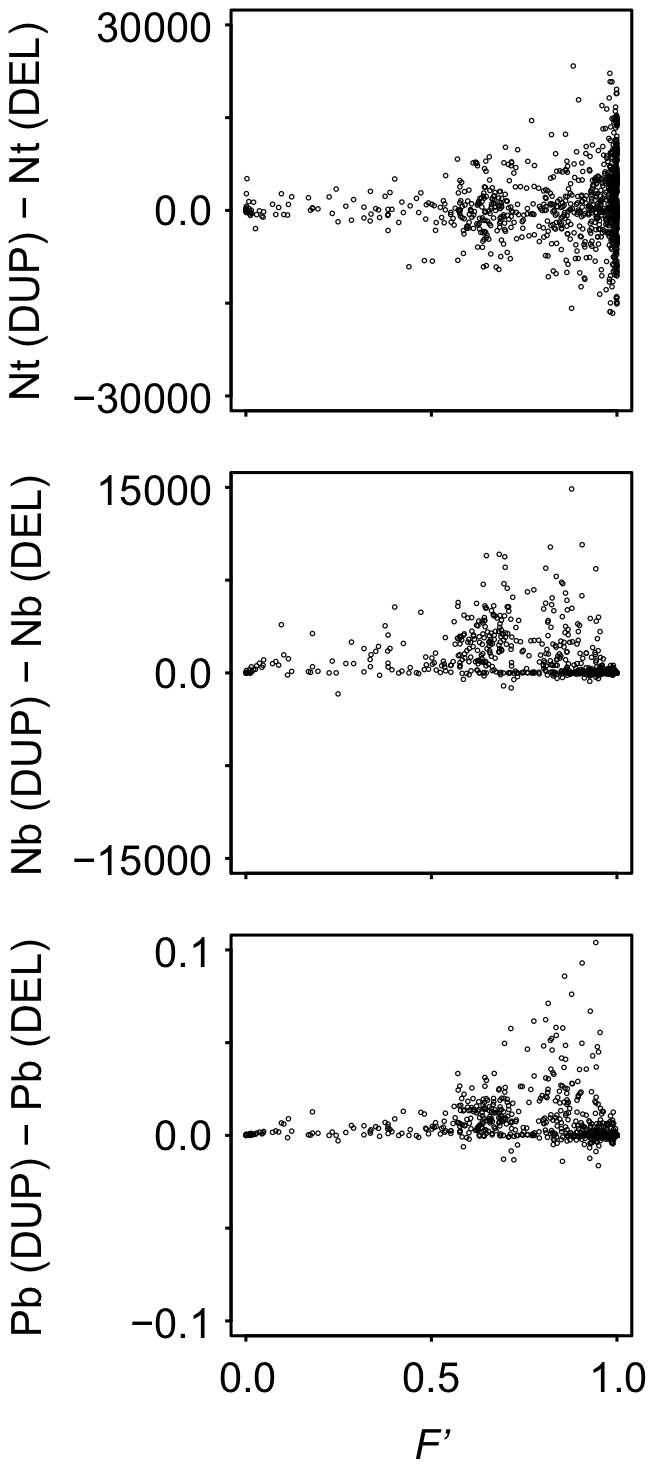
Points represent the results of a population that evolved under various conditions of random-walk optimum shift. Nt(x), Nb(x) and Pb(x) indicate the total number of mutations, number of beneficial mutations, and the proportions of beneficial mutations that arose during the evolution for mutation type x, respectively. Vertical axes indicate the difference in the number and the proportions of beneficial mutations between gene duplications and gene deletions. Horizontal axes indicate the time-averaged fitness of a population (F′).