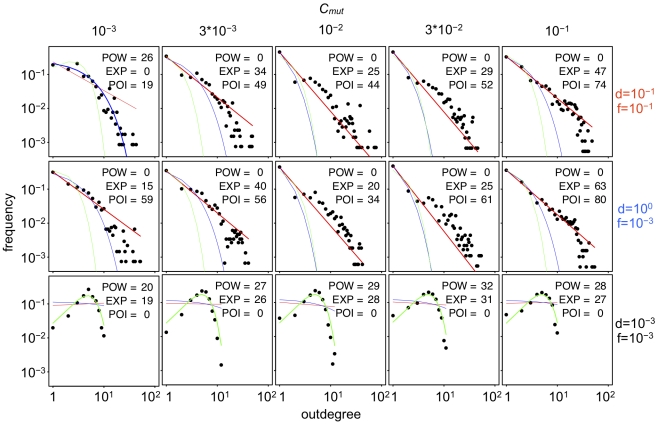
Figure 12. Outdegree distribution of assembled GRNs that evolved under various Cmut levels.
Horizontal and vertical axes in each panel show the outdegree (the number of regulatory interactions that depart from a gene) and the frequency, respectively. Note that the both horizontal and vertical axes are shown logarithmically to demonstrate the scale-free character of the distribution. Different rows and columns show the different conditions of phenotypic selection and the different values of Cmut, respectively. Lines in each panel indicate the regression of the plot to the Power law distribution (red), exponential distribution (blue) and Poisson distribution (green). Regression was estimated by a nonlinear least-square method. To judge the goodness of the regression, Akaike's information criterion (AIC) was used, and the regression that showed the smallest value of AIC was drawn as a thick line. POW, EXP and POI in each panel indicate the differences between AIC value of the best regression model and those of power-law (scale-free), exponential and poisson distributions, respectively.

