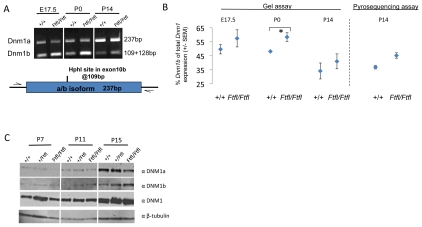
Figure 4. Developmental expression patterns of dynamin-1 isoforms.
(A) mRNA expression levels of Dnm1 isoforms during development in wildtype and mutant animals. The variant isoform region is amplified with common primers and the two transcripts are distinguished by a diagnostic HphI restriction enzyme site specific for the b isoform. The two bands representing the Dnm1b transcript cDNA run as one band and lower on the gel than the Dnm1a transcript cDNA. Note that the 1a isoform becomes increasingly upregulated during development, while the b isoform is down regulated, however this ratio of a to b transcripts is skewed in the mutant animals. Below the gel is a schematic outlining the basis of the assay. Additional replicates are shown in Figure S2. (B) Left, quantification of Dnm1b mRNA expression as assayed by PCR and visualized on agarose gels, relative to total Dnm1 mRNA in whole brain of E17.5, P0, and P14 wildtype and mutant brains. Data are expressed as the mean (± SEM) relative proportion of Dnm1b to Dnm1 mRNA in the total cleaved PCR product. *P<0.05, Student's t-test. Right, relative quantification of isoform transcripts by pyrosequencing. cDNA from P14 wildtype or homozygous fitful brains was amplified by PCR, and subsequently analyzed by pyrosequencing and quantitated for Dnm1b levels relative to Dnm1; n = 3 for each set of cDNA. (C) Protein levels of Dnm1 isoforms during development in wildtype and mutant animals. Custom made antibodies that distinguish DNM1 exon10a and exon10b middle domains were used to assay isoform protein levels in brain extracts of mice during development. Note the decrease in DNM1A in homozygous fitful mice compared to wildtype at all three ages examined (P7, P11, P15). Overall DNM1 protein levels were detected with a commercial antibody against full length DNM1. For a loading control, β-tubulin levels were detected. Significant difference in levels of DNM1b in mutant (Least square regression analysis; P<0.05).

