Figure 2. Persistence as a function of heterogeneity in node degree for three example networks.

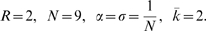
A) Regular, B) Random, and C) Heterogeneous networks, all with mean degree of 2. D) The persistence parameter  is calculated as a function of
  according to Eqn.9 with parameters: