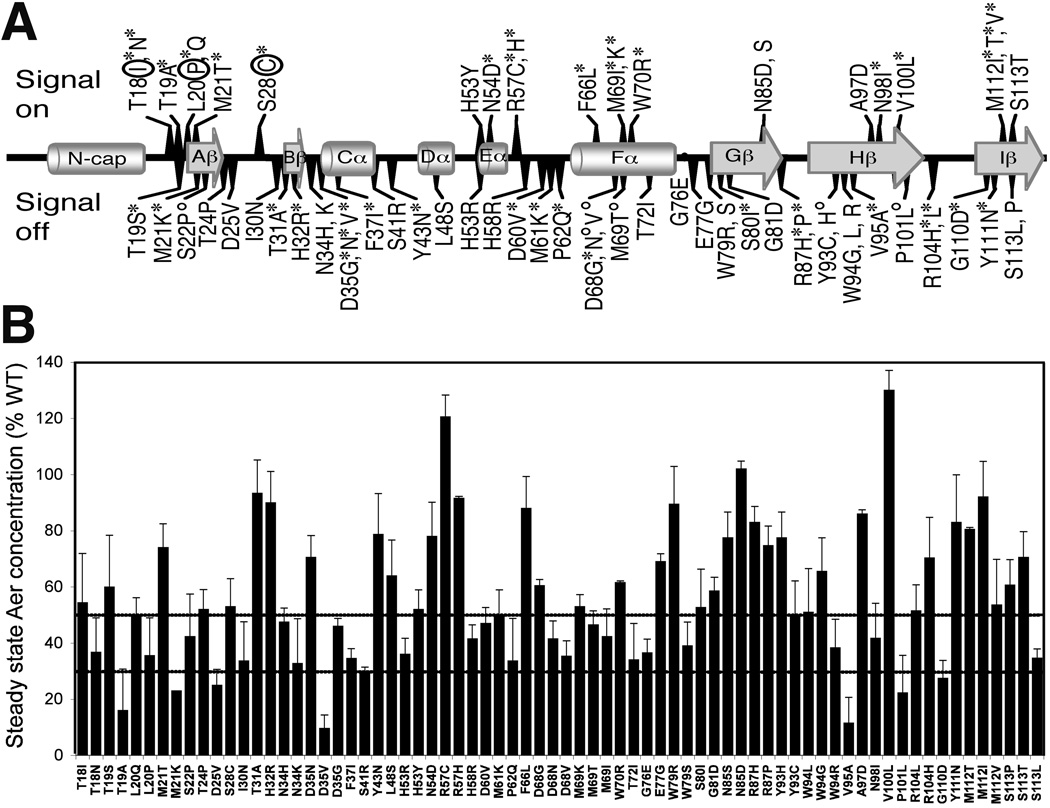
Fig. 3.
Signaling phenotypes and steady state concentrations of Aer mutant proteins. A. Amino acid substitutions that produced signal-on (above line), signal-on-biased (above line, circled), and signal-off (below line) phenotypes are mapped onto the secondary structural elements of the Aer PAS domain. Aer mutant proteins that were phenotypically rescued by Tar (see text) at low (*) or high (°) Aer expression levels are marked with an asterisk or superscripted circle, respectively. For secondary structure, cylinders represent helices, arrows represent β strands, and lines represent loops.
B. Steady state concentrations of the Aer mutant proteins relative to wild-type Aer when induced with 50 µM IPTG in the receptorless strain BT3388 (see Experimental Procedures). Mutant Aer proteins that were present at less than 50% (upper line) of wild-type Aer may be unstable. Degradation rates were determined for mutant proteins with steady state concentrations below 30% (lower line).

