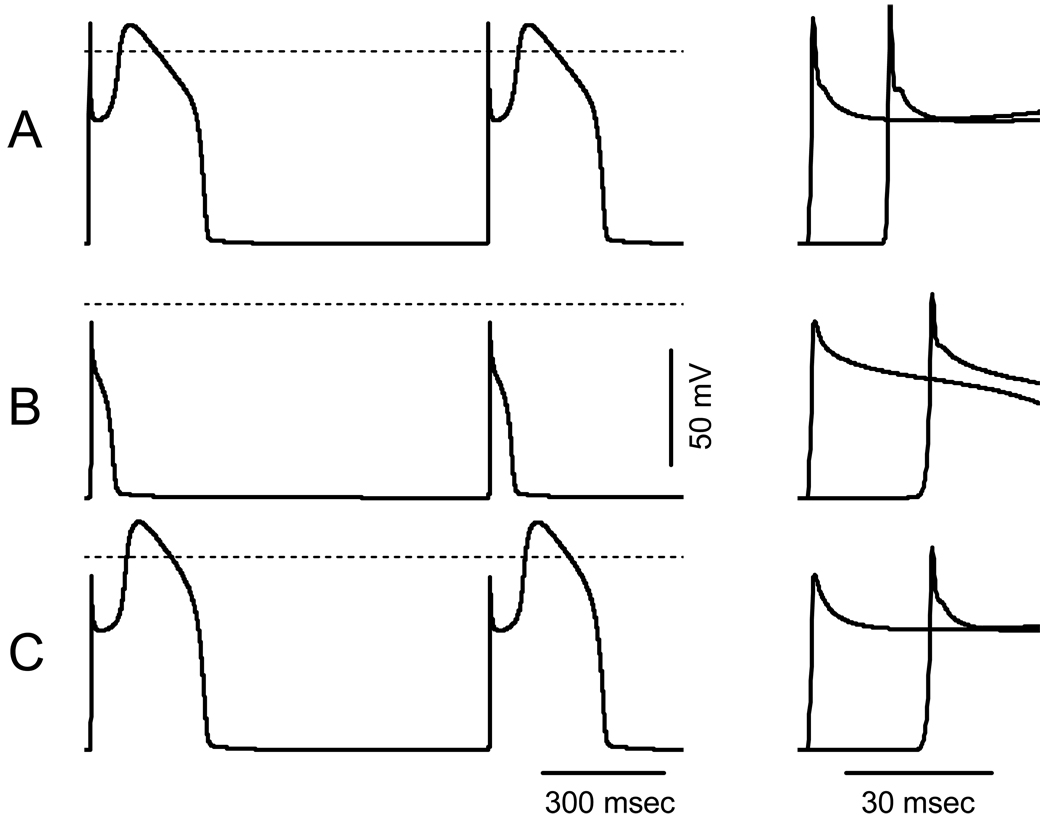
Figure 7. Propagated right ventricular APs simulated in 1 cm cable using LR2.
A: WT INa and ICa,L. B: INa with P1008S mutation (GNa reduced to 35% of WT). C: INa with P1008S-SCN5A mutation and ICaL D601E-CACNB2b variant (Rate of voltage-dependent inactivation of ICaL reduced to 85% of WT). Left panels show steady state (9th and 10th) APs from the center of the cable. Right panels show APs at the first and the last nodes of the cable at an expanded time scale to illustrate the change in the propagation velocity. Dashed lines indicate the zero potential.

