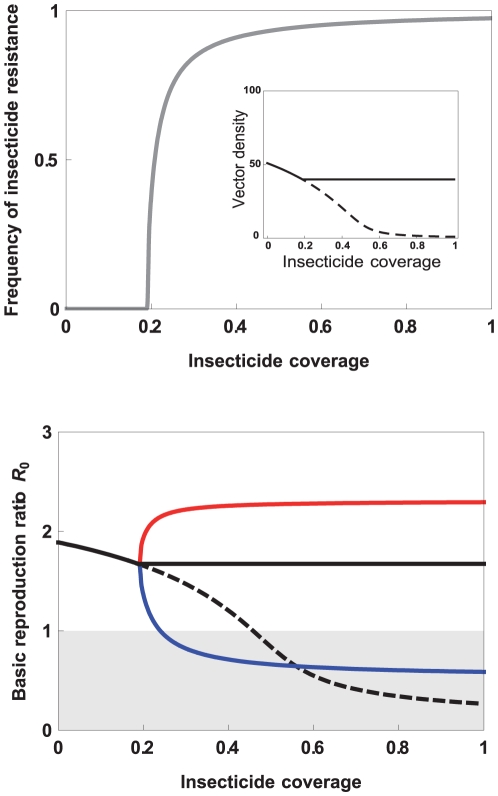
Figure 1. Effect of increasing insecticide coverage on (top) the frequency of insecticide resistance (IR, gray line), and, in the inset, the vector density with (full line) or without (dashed line) IR evolution; (bottom) the basic reproductive ratio of the infectious disease transmitted by the vector (see Box 1).
(Bottom) We consider different scenarios: in the absence of IR evolution in the vector (dashed black line), and after IR evolution when the IR insects are equally good vectors as the susceptible ones (full black line), better (red line), or worse (blue line). The gray area delimits the area where the parasite goes to extinction (R 0<1). See Appendix S1 for the details of the model and parameter values.

