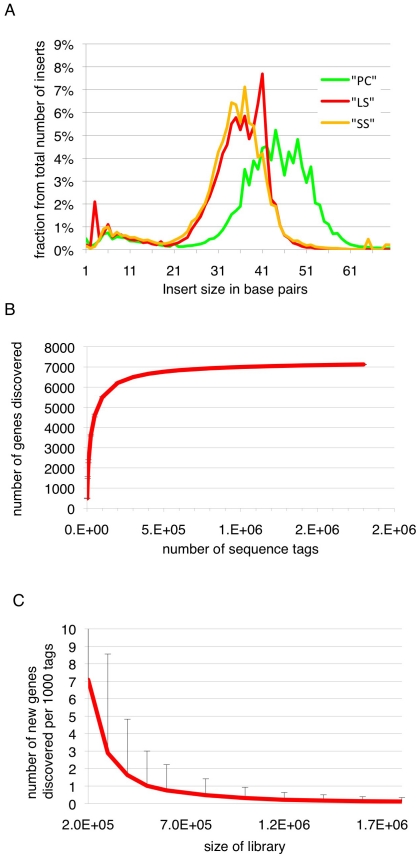
Figure 1. Insert sizes and gene discovery rate.
(A) Insert sizes of the sequence tags of the three libraries in base pairs (bp); long slender bloodstream form (LS, red), short stumpy bloodstream form (SS, orange) and procyclic form (PC, green). (B) Simulation of gene coverage from the long slender bloodstream form library; considered are all tags that lead to UTRs ≤2 kb. Error bars depict 99.99% confidence interval from five simulations assuming normal distribution. (C) Number of new genes discovered per 1000 tags depending on the total number of tags, error bars depict 95% confidence interval from five simulations, assuming normal distribution.

