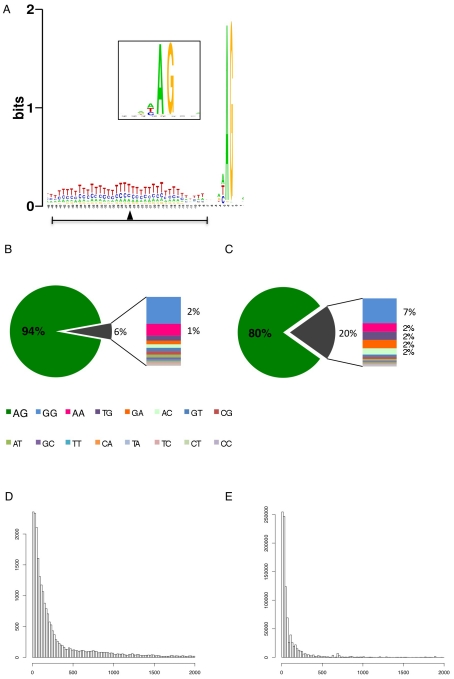
Figure 4. Splice site conservation and 5′ UTR length distribution.
(A) Consensus of the major splice sites from procyclic form T. brucei. The inset shows a close up of the conserved AG at the splice site. The upstream polypyrimidine tract is dominated by T residues starting at an average distance of 26 nucleotides (black triangle; ±19) upstream of the splice site. (B–C) Splice site comparison. Abundance of dinucleotides at the splice acceptor sites for (B) major splice sites and (C) minor splice sites in T. brucei procyclic forms. (D–E) Untranslated region (5′ UTR) length distribution in procyclic forms using the major splice site on a per gene basis (D). 5′ UTR length distribution of the major splice site on a per transcript basis (E).

