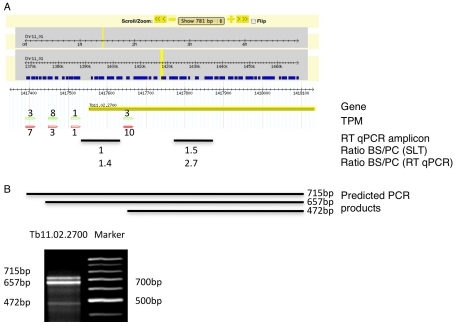
Figure 5. Example of an alternatively spliced transcript (Tb11.02.2700).
(A) Display of the splicing profile for Tb11.02.2700 using Gbrowse. Spliced leader tags from bloodstream form (red) and procyclic form (green) are shown; numbers indicate tags per million (TPM). The position and size of the RT qPCR amplicon is depicted by a black bar (RT qPCR amplicon). Below the bar the mRNA abundance ratios as determined by SLT and qPCR respectively, are shown. (B) Expected size of PCR product using a spliced leader-specific oligonucleotide together with a gene specific oligonucleotide are depicted. Gel shows PCR products from procyclic cDNA.

