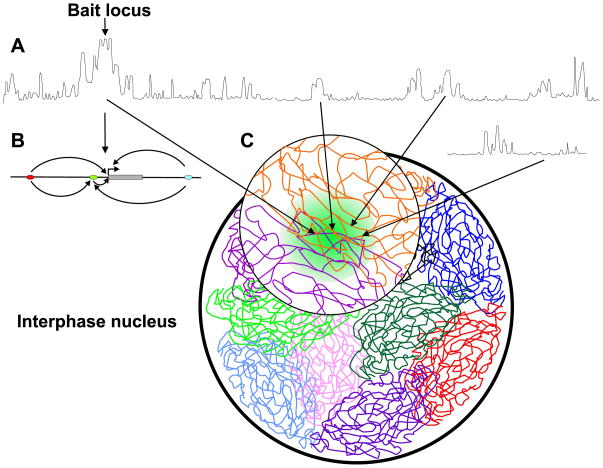
Figure 1.
Microarray profile of long range interactions by 4C. (A) Long-range contacts of the bait across the same chromosome (top profile) and with loci on another chromosome (bottom profile). The peaks represent long-range contacts and their magnitudes indicate the interaction frequency. The dominant peak cluster centered at the bait reflects the high interaction frequency of the locus with the nearby sequences within a few million bp distance. Most of the reported distant regulatory elements are found within this region (panel B). (B) Finer-scale spatial interactions within the bait region. Regulatory sites (ellipses) are in long-range contacts (arrows) with other regulatory sites and genes (gray rectangle), generating a complex network of direct and indirect contacts. (C) The chromosomes are folded in the interphase nucleus into chromosome territories. Chromosomal loci are non-randomly engaged in long-range contacts with other distant loci from the same chromosomes and with loci from other chromosomes creating spatial micro-environments.

