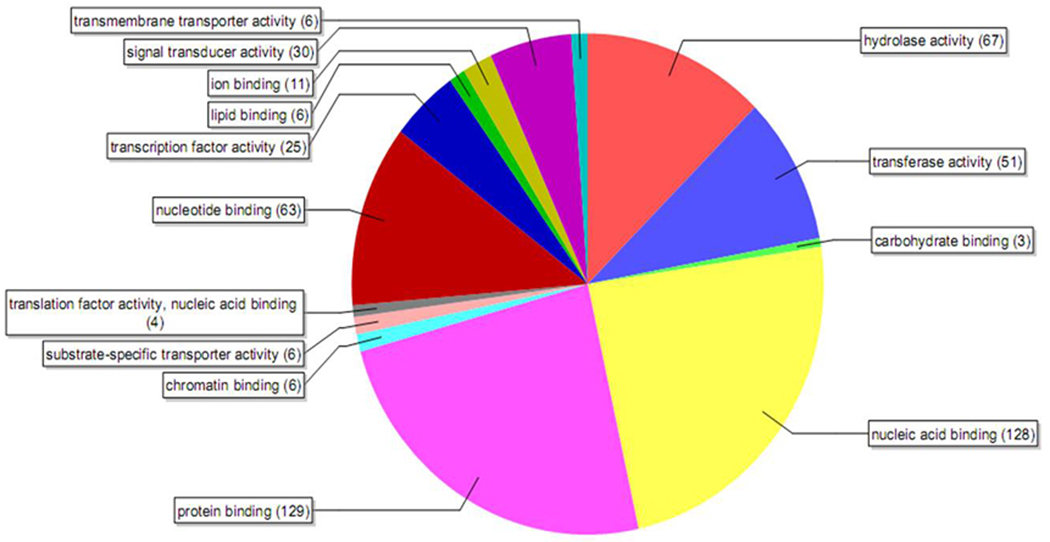
Fig. 1.
Pie-chart showing the distribution of genes based on their annotations on molecular functions using Blast2go software. Microarray analysis was done with RNA samples from day 4 PAE ovary tissues and whole body. The genes filtered by Bejamini- Hochberg analysis that were 3-fold higher in the ovary when compared to their expression in the whole body with a p-value of <0.001 were considered.

