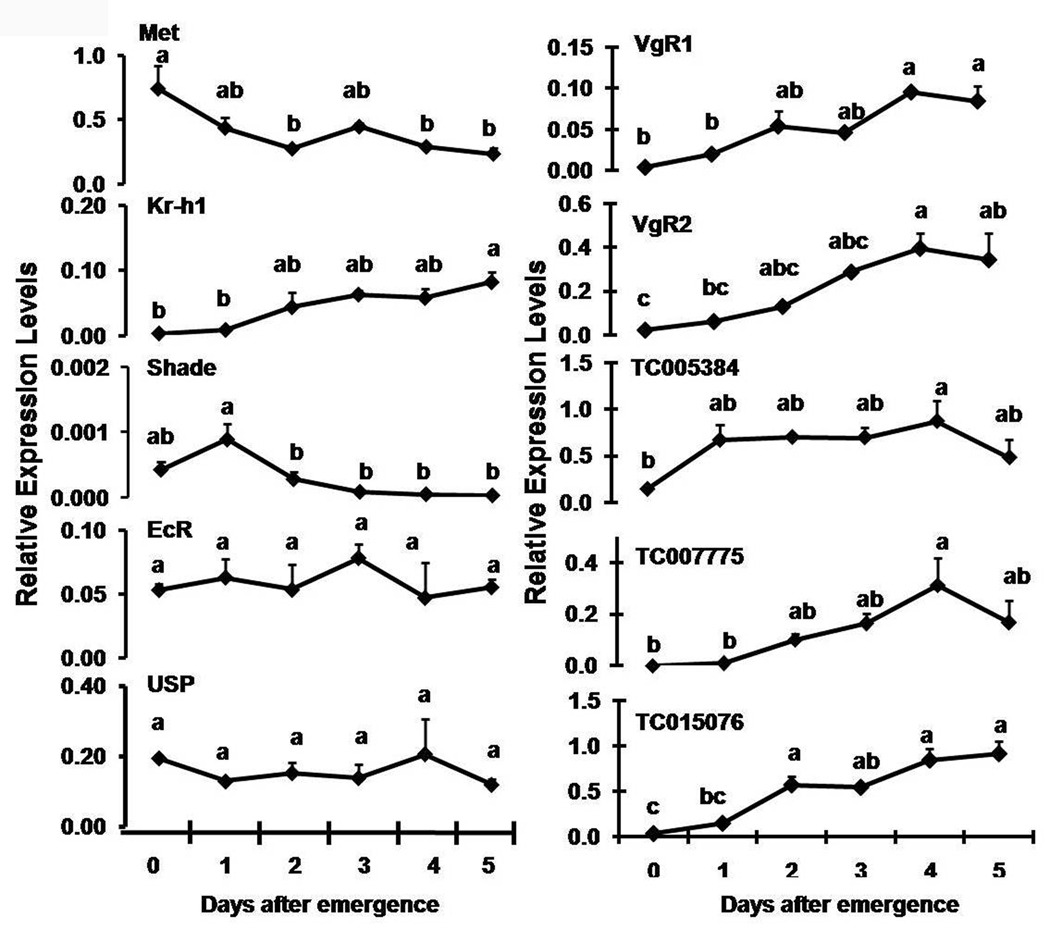
Fig. 2.
Relative expression levels of select genes in the ovaries during 0–5 days PAE were determined by qRT-PCR. RNA was extracted from the ovaries at specific time-points. Relative expression in comparison to ribosomal protein (rp49) gene expression was determined. Mean ± S.E. of three independent replicates are shown. One-way ANOVA analysis was performed using JMP software (SAS institute). The mean expression levels marked with the same alphabetical letter do not differ significantly at p<0.05.

