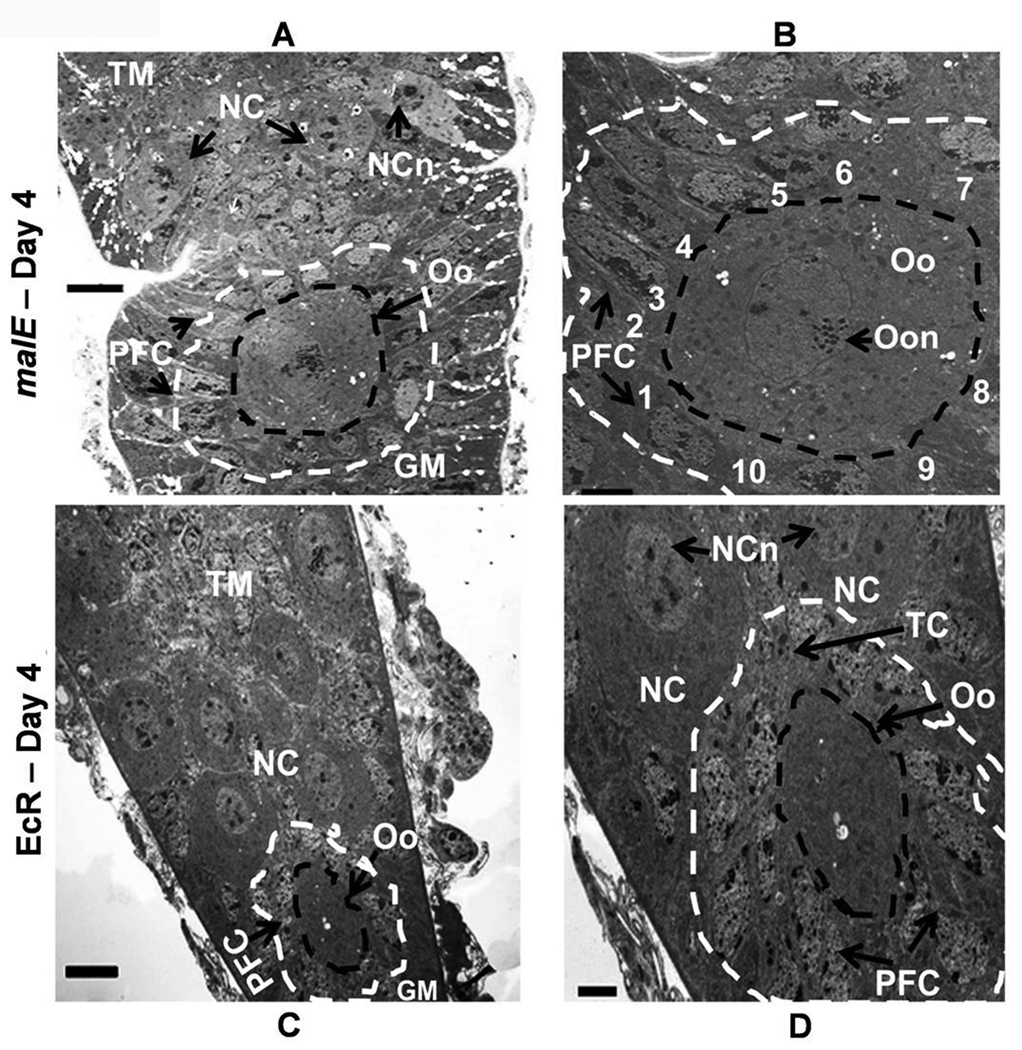
Fig. 6.
Ultrathin longitudinal section of the ovariole showing oocyte development at different stages in the germarium of malE RNAi (control, A & B) and EcR RNAi (C & D) on day 4 PAE. Panel A, Neck region showing germarium with developing secondary oocyte surrounded by follicular cells; Tropharium with nurse cells occupy the distal portion of the germarium; black circle- boundary of the secondary oocyte; White circle- boundary of the surrounding follicle cells. Panel B, Enlarged circled area of A with the follicle cells surrounding the secondary oocyte is numbered 1–10. Panel C, Germarium and tropharium regions of EcR RNAi beetle ovariole; Black circle, boundary of the primary oocyte; White circle- boundary of the surrounding follicle cells. Panel D, Germarium region circled in C at higher magnification; the primary oocyte is surrounded by follicular cells; also seen are trophic cards and nurse cells. GM, Germarium; NC, Nurse cells; NCn, Nurse cell nucleus; Oo, Oocyte; Oon, Oocyte nucleus; PFC, follicular cell; TC, Trophic card; TM, Tropharium. All micrographs are arranged with tropharium on the top and germarium towards the bottom. N=4. Scale Bar: A,C − 5 µm; B, D − 2 µm.

