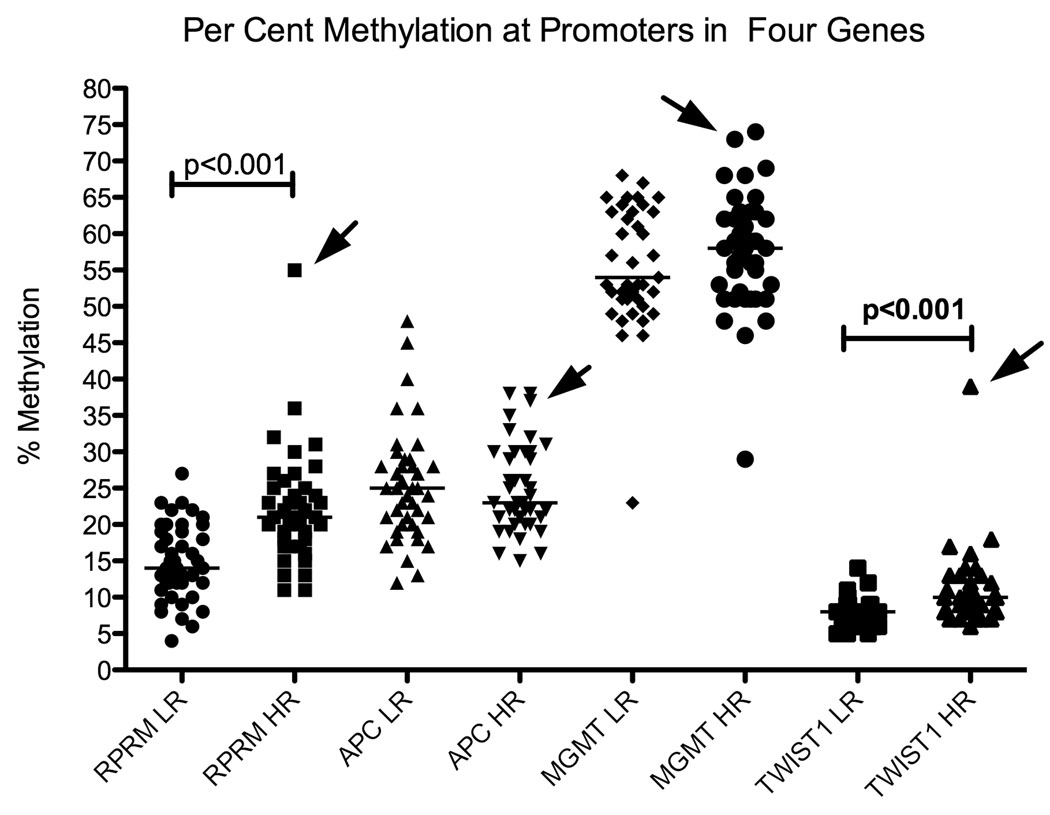
Figure 1.
Scatter plots indicate the percent methylation of each gene, measured from DNA from residents of low risk (LR) and high risk (HR) areas. Arrows indicate the points representing the outlier subject, whose gastric histology showed widespread intestinal metaplasia and focal areas of indefinite dysplasia.

