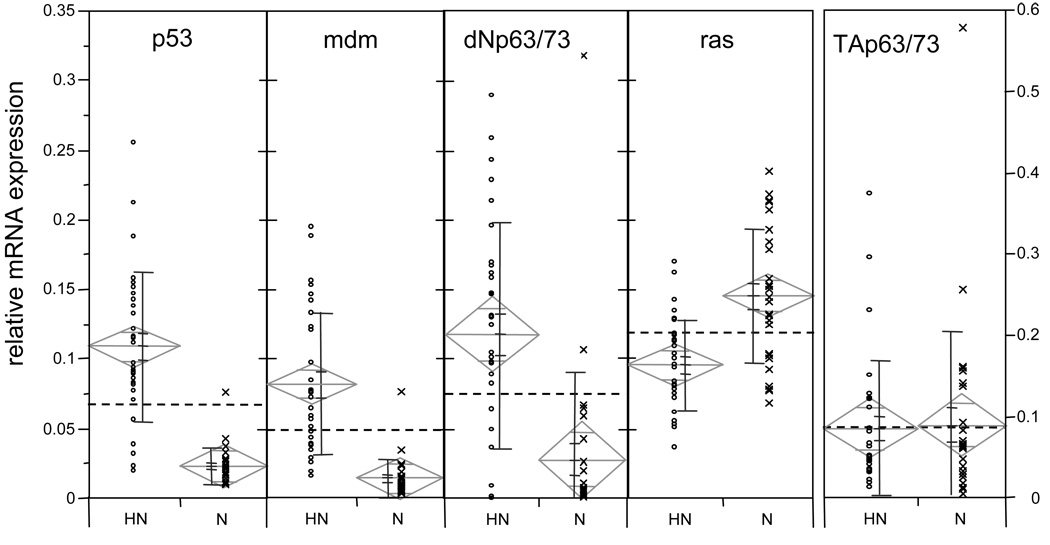
Figure 6. Association between relative transcription levels for mdm, ras, p53-, ΔNp63/73- and TAp63/73-like mRNA isoforms and haemocyte status, neoplastic (L; n=30) and normal (N; n=27), in M. trossulus.
mRNA expression levels are relative to a standard dilution curve. Data points (◦, x) represent the average of triplicate wells. The bars next to the individual data points represent, from top to bottom, standard deviation, standard error of the mean, and mean. The means diamonds graphic illustrates the group mean (center horizontal line), the 95 % confidence interval (vertical points of diamond), overlap marks (top and bottom horizontal lines), and the width of the diamond indicates sample size. The dotted line shows the grand mean. If the 95 % confidence intervals do not overlap, the group means are significantly different (but the reverse is not necessarily true).

