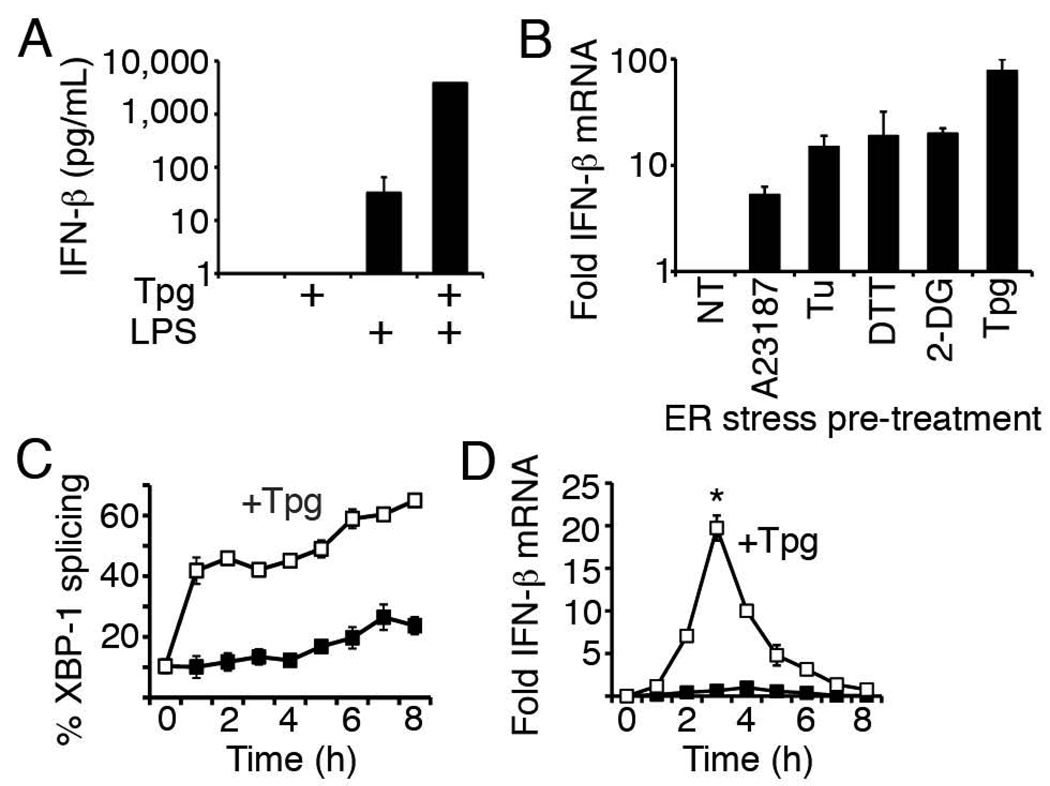
Figure 1. Synergistic induction of IFN-β in macrophages by LPS and ER stress.
A) Murine bone marrow macrophages were pre-treated with 1h thapsigargin (Tpg), and then stimulated with 6h LPS. Results were combined from 2 independent experiments. *P=0.001 vs. LPS. B) Murine marrow macrophages were pre-treated with ER stress inducers calcium ionophore (A23187), tunicamycin (Tu), dithiothreitol (DTT), 2-deoxyglucose (2-DG), Tpg, or no ER stress inducer (NT) prior to 3h of LPS. Relative mRNA expression was determined by quantitative PCR (qPCR). Bars represent fold induction of IFN-β mRNA by ER stress pre-treatment plus LPS compared to LPS without ER-stress pre-treatment (NT=1). Results were combined from 3 independent experiments. Except for homocysteine, p=<0.05 for other ER stress inducers vs. NT. (C, D) RAW264.7 macrophages were pretreated with Tpg for 1h and then LPS for up to 8h. Black boxes are LPS only and white boxes are Tpg+LPS. %XBP-1 splicing (C) represents ratio of spliced and spliced+unspliced PCR products. D) For fold induction of IFN-β mRNA, results were combined from 2 independent experiments by normalizing to LPS-induced IFN-β mRNA at 4h (=1). *P=0.003 vs. LPS. Representative experiments for B and D are shown in Supplemental Figure 1.

