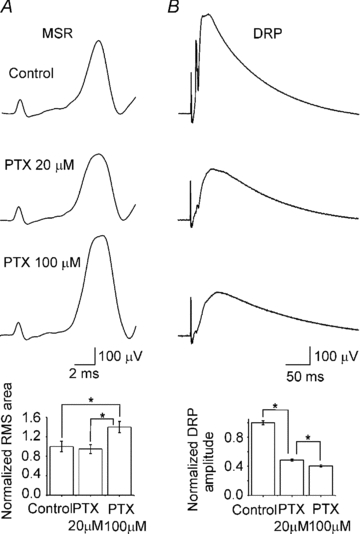
Figure 2. Action of picrotoxin on the MSR and DRP.

A and B, top to bottom, representative MSR and DRP evoked by dorsal root stimulation (2T) and simultaneously recorded in control Ringer solution and in the presence of picrotoxin (PTX) at 20 and 100 μm. Bar graphs, normalized MSR area and DRP amplitude in control Ringer solution and in the presence of PTX. Vertical lines indicate s.e.m. Asterisks indicate statistical difference with respect to the control for the MSR and with respect to the control and between PTX at 20 and 100 μm for the DRP (n = 11; P < 0.05).
