
Figure 3. Interactions between SICI, ICF and LIHI.
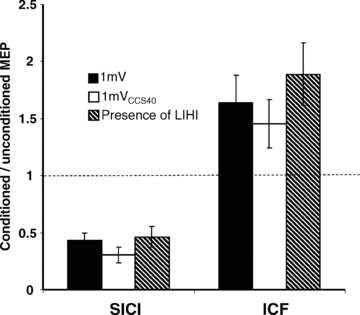
The y-axis shows the ratio of the conditioned vs. the unconditioned MEP. Ratios < 1 represent inhibition, ratios > 1 represent facilitation. Error bars represent standard errors of the mean. The left three columns show the results for SICI: SICI in the presence of LIHI (hatched column) was compared with the SICI alone matched for test stimulus amplitude (TS1mV, filled column) and test stimulus intensity (TS1mVCCS40, open column). The right three columns show the results for ICF: ICF in the presence of LIHI (hatched column) was not significantly different compared to ICF alone matched for test stimulus amplitude (TS1mV, filled column) and test stimulus intensity (TS1mVCCS40, open column). SICI and ICF were not significantly changed in the presence of LIHI.