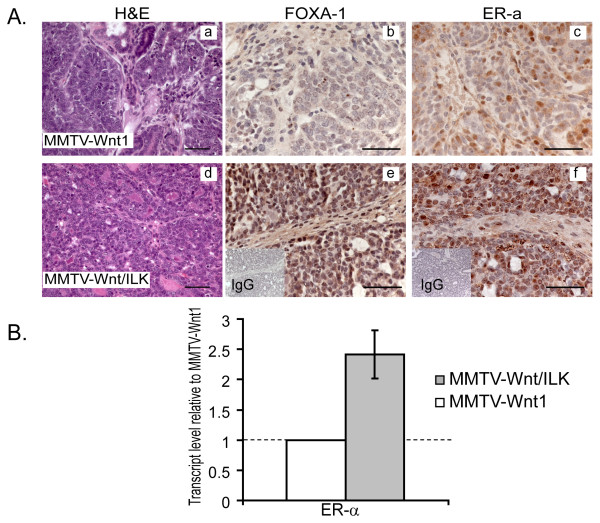
Figure 6.
Immunohistochemical staining and PCR analysis. (a) Immunohistochemical staining of tumors from MMTV-Wnt/ILK mice exhibit strikingly enhanced expression of FOXA1 and ER-α. Magnifications: (a,d) 40×; (b,c, and e,f) 63×. Scale bars, 50 μm. (b) Q-RT-PCR analysis shows a 2.4-fold increase in ER-α transcripts levels in MMTV-Wnt/ILK tumors. Results are shown as fold change (FC) of ER-α expression in MMTV-Wnt/ILK over MMTV-Wnt1 tumors.

