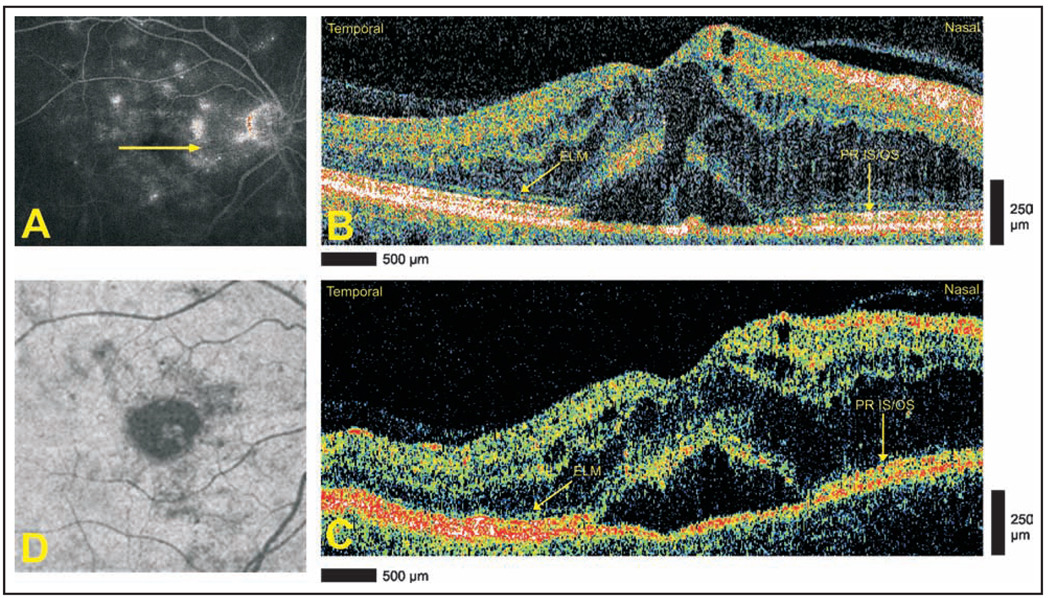
Figure 1.
Diabetic maculopathy and serous retinal detachment. (A) Late-phase optomap fa fluorescein angiogram demonstrating diffuse leakage. Arrow depicts direction of optical coherence tomography scans. (B) Cirrus HD-OCT (Carl Zeiss Meditec, Dublin, CA) and (C) StratusOCT (Carl Zeiss Meditec) images, respectively, demonstrating the intact external limiting membrane (ELM) temporally and the photoreceptor inner segment/outer segment (PR IS/OS) nasally. The sensory retina in the area of detachment is blurred, and the continuity of the ELM and PR IS/OS is not appreciated. (D) Advanced visualization C-scan image using a retinal pigment epithelium-aligned contour over a 53-µm thickness centered above the retinal pigment epithelium. The area of serous retinal detachment is seen as a low-reflectivity spot in the surrounding high-reflectivity areas.

