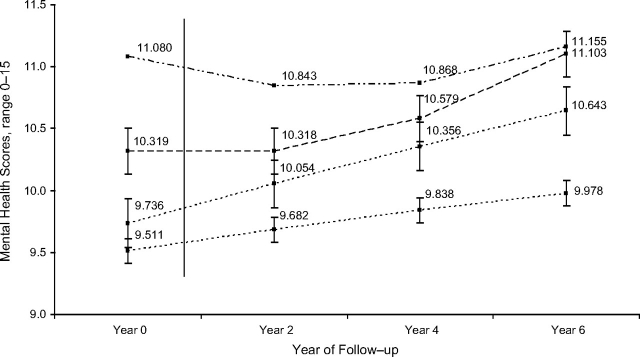
Figure 1.
Adjusted mental health scores at years 0, 2, 4, and 6, stratified by sex and teenage parenthood, National Longitudinal Survey of Youth, 1997. Mental health scores were adjusted for percent of poverty level, paternal education, maternal education, both biologic parents in home, number of children in home, parental monitoring, parental relationship quality, PIAT score, residential location, and difference in months between 1997 baseline interview and year 0 interview. Values for mental health scores represent the average score when all continuous variables are at their grand mean and all categorical variables are equal to 0. Solid vertical line represents the mean time post-year 0 interview when the teenage births occurred (349.49 days post-year 0 interview). PIAT, Peabody Individual Achievement Test. Dashed lines: top, nonparenting teenage males; second, teenage fathers; third, nonparenting teenage females; bottom, teenage mothers.

