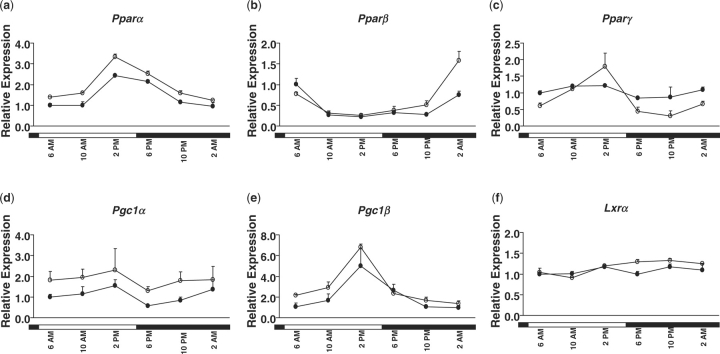
Fig. 4.
Daily expression profiles of genes encoding nuclear receptors and co-factors (A, PPARα; B, PPARβ; C, PPARγ; D, PGC1α; E, PGC1β; and F, LXRα) in female- (open circle) and male- (closed circle)mouse livers. Relative mRNA levels of genes were quantified by real-time PCR. Results were normalized by comparison to the amount of β-actin and expressed as relative values to those of male mice at 6:00 a.m. for all genes. Data are means ± SD of five mice at each time-point. Open bar, lights on; closed bar, lights off.

