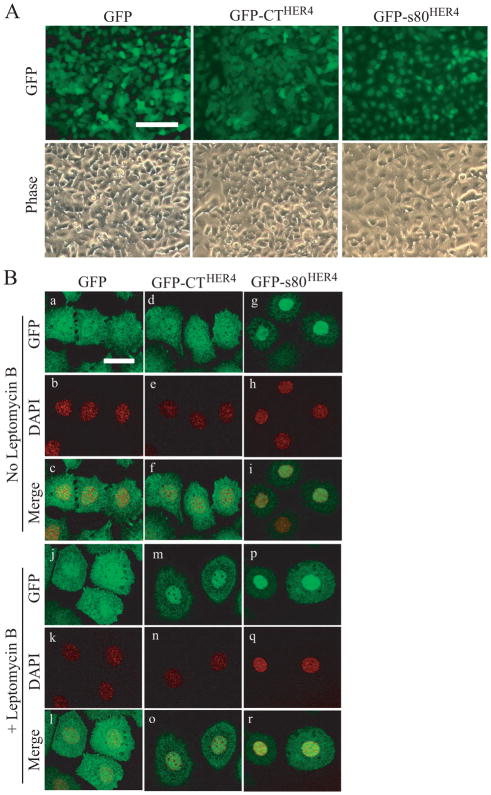
Fig. 4. Localization of GFP, GFP-CTHER4, and GFP-s80HER4 in HC11 cells.
A, Live cell microscopy showing the localization of GFP fluorescence in HC11 cells stably expressing GFP, GFP-CTHER4, or GFP-s80HER4. Phase contrast is shown in lower panels. Bar, 100 μm, applies to each image. B, HC11 cells stably expressing GFP (a-c, j-l), GFP-CTHER4 (d-f, m-o) or GFP-s80HER4 (g-i, p-r), were treated without (a-i), or with (j-r) 20 ng/ml of leptomycin B for 24 h, then analyzed for GFP fluorescence by confocal microscopy. Subcellular distribution of GFP (a, j), GFP-CT (d, m), GFP-s80 (g, p), and DAPI (b, e, h, k, n, q) were visualized and captured. The merged pictures were also shown (c, f, i, l, o, r). Bar, 30 μm, applies to each image.

