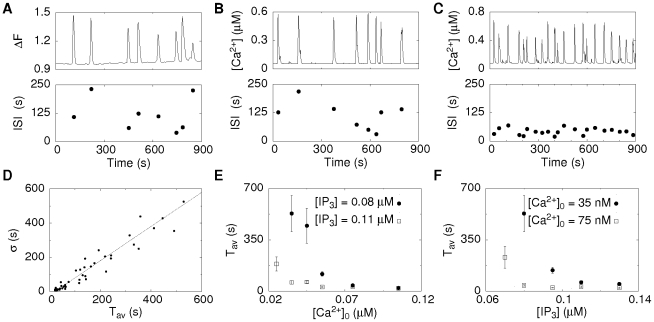
Figure 3. Stochasticity of Ca2+ oscillations.
A: An experimental example of  oscillations in an astrocyte. The varying ISIs demonstrate the stochasticity of spiking. B,C: Simulations of the cellular
  dynamics of a cell with 47 clusters each having a random number of channels between 4 and 16 for different
  base level
  concentrations and the standard parameters given in Table 1. For a low
  base level of 30 nM spiking is rather slow and irregular (B). For an increased
  base level of 50 nM spiking becomes faster and more regular (C). D: The simulated
  −
− relation, where dots correspond to spike trains of single cells having different
  and
and  concentration (see Figure 5 in Text S1), is in accordance with the experimentally observed one [5] supporting the wave nucleation mechanism. E,F: The dependence of the average period
  on the
  concentration and the
  resting concentration obtained in simulations show that regular spiking is more likely if one concentration is high.

