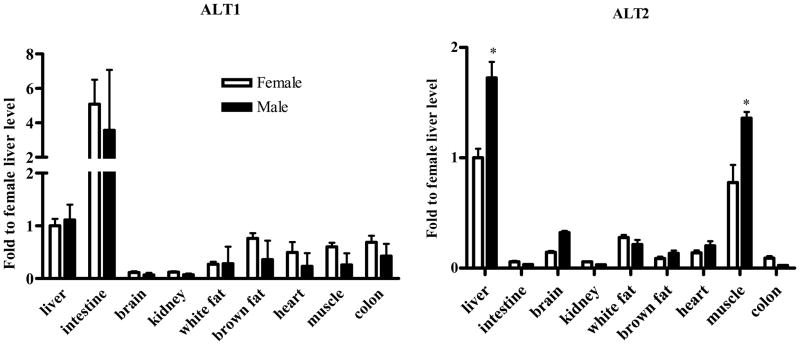
Fig. 2.
Quantitative PCR of ALT1 and ALT2 tissue distribution. Quantitative RT-PCR was conducted on the tissues indicated. The relative gene expression levels were adjusted to cyclophilin across the tissues and relative to the liver tissue of female rats. Data were expressed as mean + S.E. (n = 5 animals). *: p < 0.05, compared to the female.

