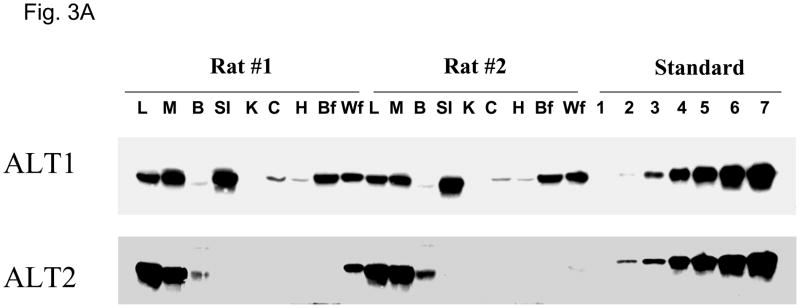
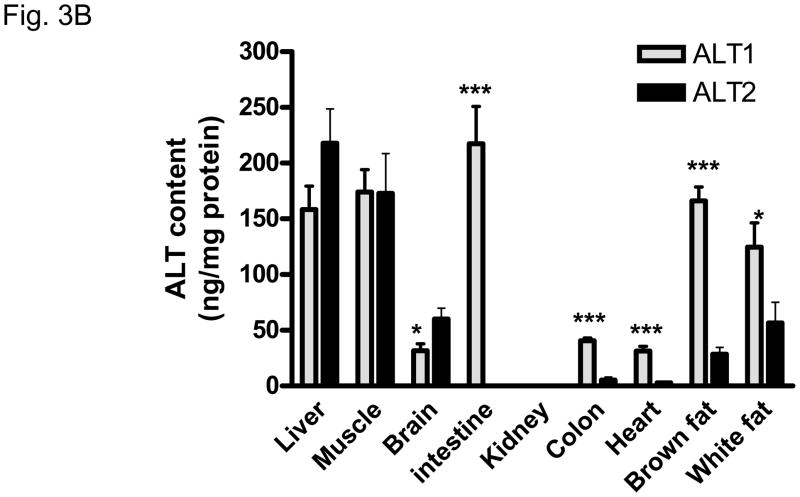
Fig. 3.
Quantitative analysis of rat ALT isoenzyme tissue distribution. A. Representative Western Blot of ALT1 and ALT2 in male rats. 20 ug of tissue lysates were loaded to each lane. L: liver, M: muscle, B: brain, SI: small intestine, K: kidney, C: colon, H: heart, Bf: brown fat, Wf: white fat. The number indicates the amount of recombinant proteins of ALT1 and ALT2 respectively; 1: 0.1ng, 2: 0.5 ng, 3: 1.0 ng, 4: 3 ng, 5: 5 ng, 6: 8 ng, 7: 10 ng. B. Quantification of ALT isoenzyme tissue distribution in male rats. Grey column: ALT1; Black column: ALT2. Data are expressed as mean + S.E (n = 5 animals); *: p < 0.05; ***: p < 0.001, vs. ALT2 in the same tissue.


