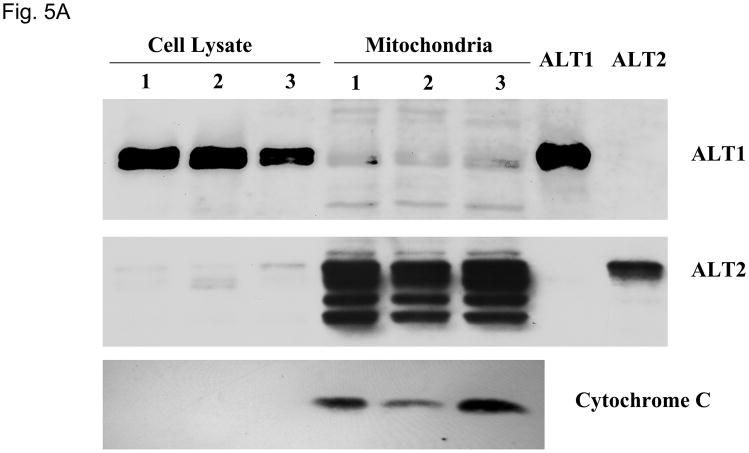
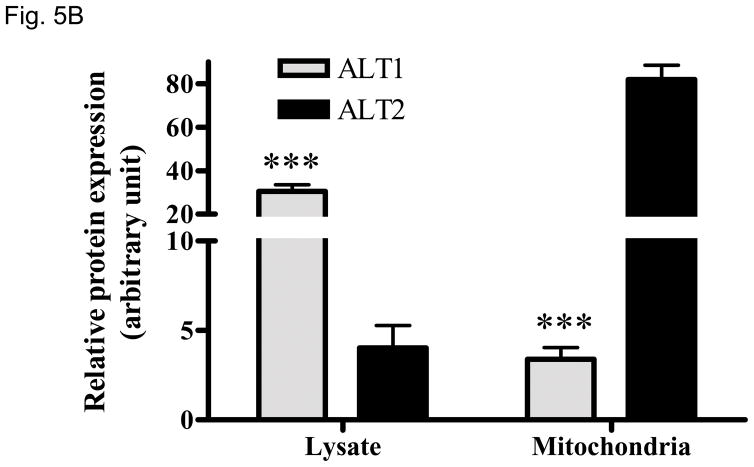
Fig 5.
Relative ALT isoenzyme distributions in liver lysate and mitochondria. 10 ug of lysate or mitochondria isolated from three male rats, alone with 2 ng of recombinant ALT1 and ALT2 were loaded for Western analysis (5A) and quantitation (5B), blotted for ALT1, ALT2 and mitochondrial marker cytochome C respectively. Relative protein expression was determined by densitometer and expressed as mean + sem. ***: p < 0.001, compared to ALT2 in the same fraction.


