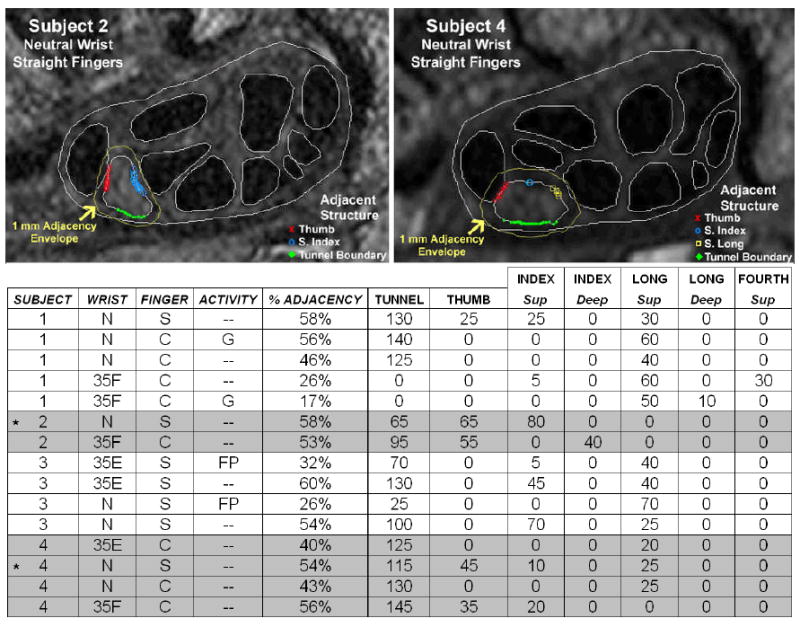
Figure 7.

Nerve adjacency analysis: adjacency of the nerve to the surrounding structures at the hook of the hamate. The locations of adjacency are plotted on two segmented MRI sections (top). Data associated with the images are marked in the table with a *. In the table (bottom), % adjacency is the percentage of the nerve boundary within 1mm of a tunnel structure, and the numerical value associated with each tendon or the tunnel boundary is the number of degrees along the nerve boundary lying within 1mm of that respective structure.
