Fig. 6.

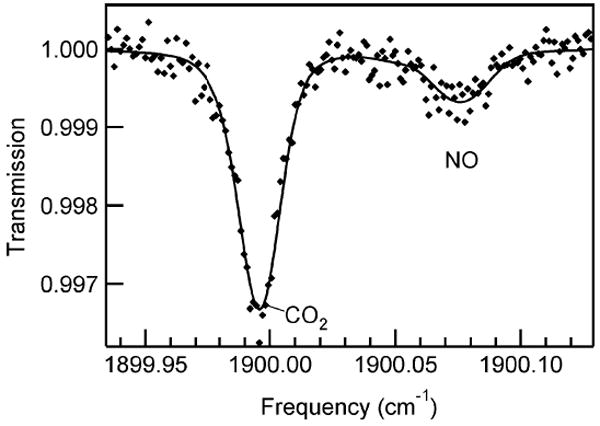
Infrared QCL spectrum of 18.1 ppb NO and 4.5% CO2 in exhaled breath (6-L/min exhaled flow). Spectrum was collected at 10 Hz. Markers are data and the solid line is the nonlinear least squares fit to the data. Sample pressure 35 Torr.

Infrared QCL spectrum of 18.1 ppb NO and 4.5% CO2 in exhaled breath (6-L/min exhaled flow). Spectrum was collected at 10 Hz. Markers are data and the solid line is the nonlinear least squares fit to the data. Sample pressure 35 Torr.