
Figure 1.
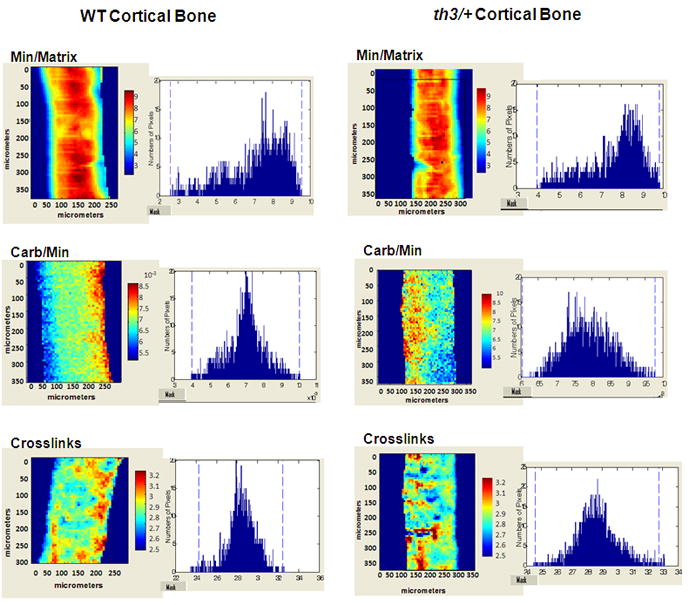
Typical FTIR images of cortical sections of the th3/+ mice and their controls at age 4 months. Pixel histograms adjacent to the figures illustrate the data distribution in the images shown. Changes in distribution between affected and WT animals indicate differences in material properties. Min/Matrix mineral-to-matrix ratio, Carb/Min carbonate-to-mineral ratio