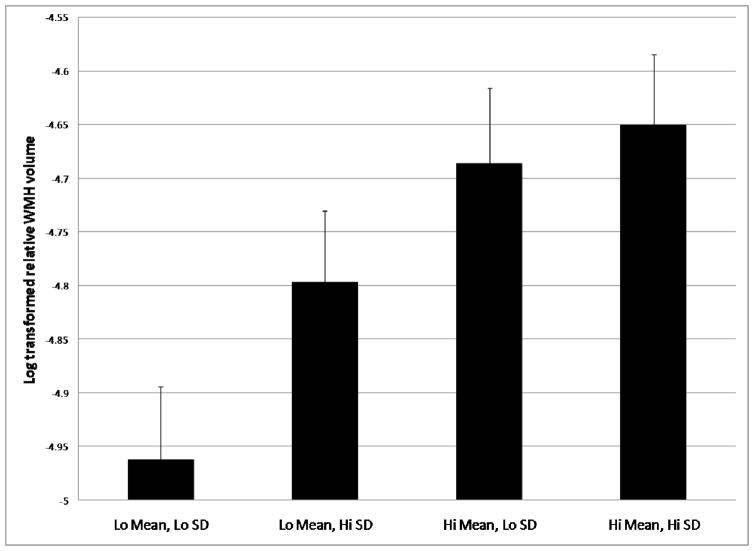
Figure 1.
Differences in log transformed relative WMH volume across blood pressure groups. There was a significant monotonic trend across blood pressure groups (p=.015). Mean values are adjusted for age, sex, and treatment status. Group 1 contains participants with lower mean BP (<96.48 mmHg) and lower fluctuation (SD < 7.21 mmHg); group 2comprises participants with lower mean BP (<96.48 mmHg) and higher fluctuation (SD < 7.21 mmHg); group 3 comprises participants with higher mean BP (>96.48 mmHg) and lower fluctuation (SD < 7.21 mmHg); and group 4 comprises participants with higher mean BP (>96.48 mmHg) and higher fluctuation (SD < 7.21 mmHg).

