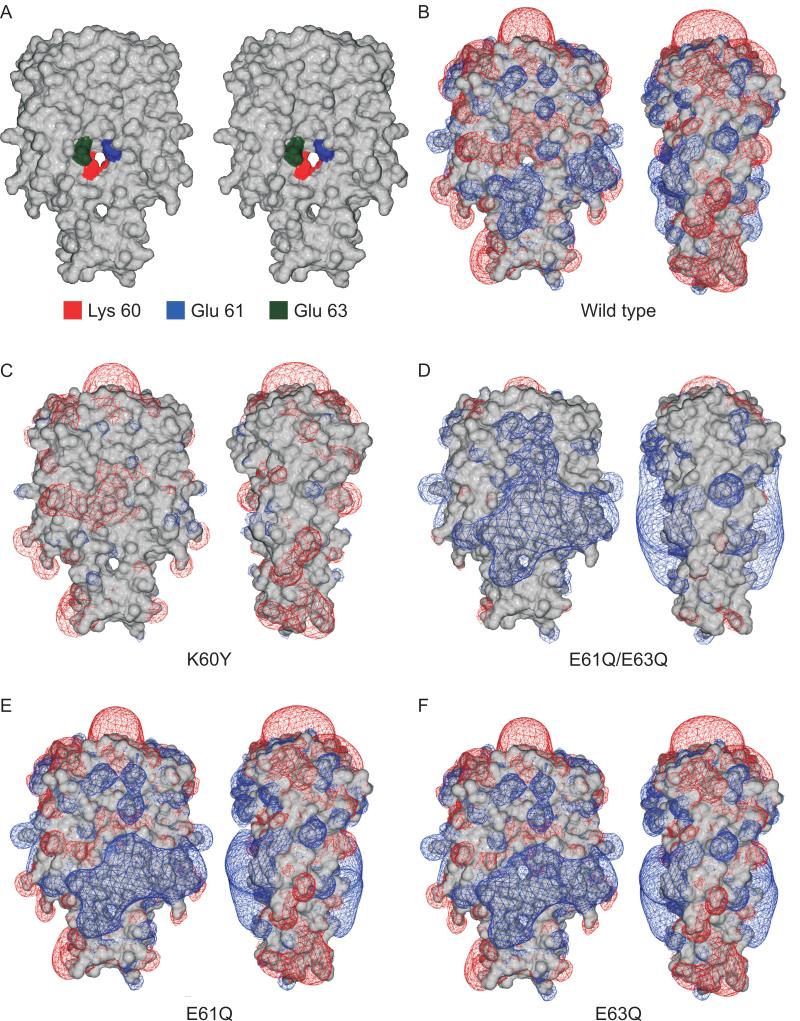
Figure 7.
Stereogram and electrostatic surface charge maps of wild type OspC and OspC site-directed mutants. A stereogram of a surface projection of the 1GGQ OspC crystal structure (Kumaran et al., 2001), in which the monomers are rotated 10 degrees, is presented in panel A. The residues selected for site-directed mutagenesis are indicated. In panel B the wild type-type A OspC dimer is shown in two rotations with the calculated electrostatic potential superimposed on the molecular surface (Swiss-PdbViewer 4.0.1; Poisson-Boltzman method; blue is positive, red negative). Electrostatic potential surface charge maps (panels C-F) are shown for OspC site-directed mutants (indicated below each panel). The charge maps for the mutants were superimposed onto the structure of wild type OspC.

