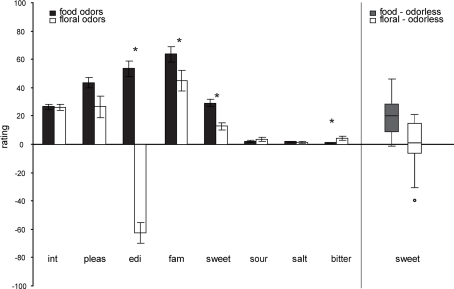
Figure 2.
Left panel: Average perceptual ratings (y axis) over subjects (±s.e.m.) of the food (chocolate-cookie and strawberry-and-cream) and floral (rose and lilac) odors (x axis). Int, intensity; pleas, pleasantness; edi, edibility; fam, familiarity. Stars represent significant differences. Right Panel: Box plots illustrating the range and variability of sweetness rating for food and floral odors. Whiskers reflect the lowest and highest observation, the upper and lower boundaries of the box represent the upper and lower quartiles, the middle line of the box represents the median and the circle represents a single outlier, that was removed from the correlation analyses). Note that there is similar across-subject variability in food and floral sweetness ratings, as illustrated in right box and whisker plots.

